Client Activity Data

Welcome to the Client Activity Data help guide. This page helps you find, filter, and understand the health and fitness metrics synchronised from your client's wearable devices and health platforms, such as Apple Health, Health Connect, Fitbit, Garmin, Whoop, Polar, Strava, and Oura. Use these tools to track their progress and tailor your dietary or health programmes effectively.

1. Display & Filter Client Wearable Data

Learn how to access the activity overview and filter your client's fitness metrics by specific dates to view historical logs.

1
Open the Activity Tab

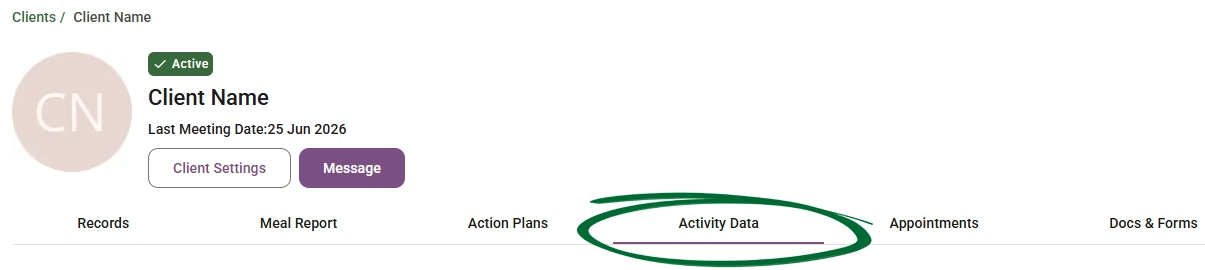
Navigate to the specific client's profile page and click on the Activity Data tab from the main client navigation menu to open the wearable overview page.
Open Client Activity Data
2
Select a Date Range
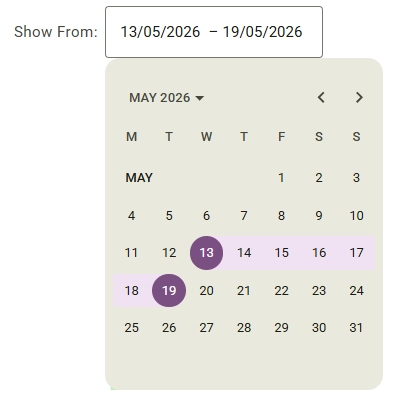
Locate the Show From date field on the right side of the panel. Click inside the field to open the drop-down interactive calendar.
Client Filter Date Range Picker
3
Choose Your Tracking Window

Navigate through months using the left and right arrows on the calendar, then click a start date to highlight your end date and your desired tracking window.

Note: If a client hasn't synced their wearable device or lacks entries for the selected period, a friendly message stating "You don't have any data to preview here" will appear in the centre of the screen.
2. Inspect Client General Data

Review baseline metrics and core body tracking statistics shared directly from your client.

1
Open the Activity Tab

Navigate to the specific client's profile page and click on the Activity Data tab from the main client navigation menu to open the wearable overview page.
Open Client Activity Data
2
Select the General Menu
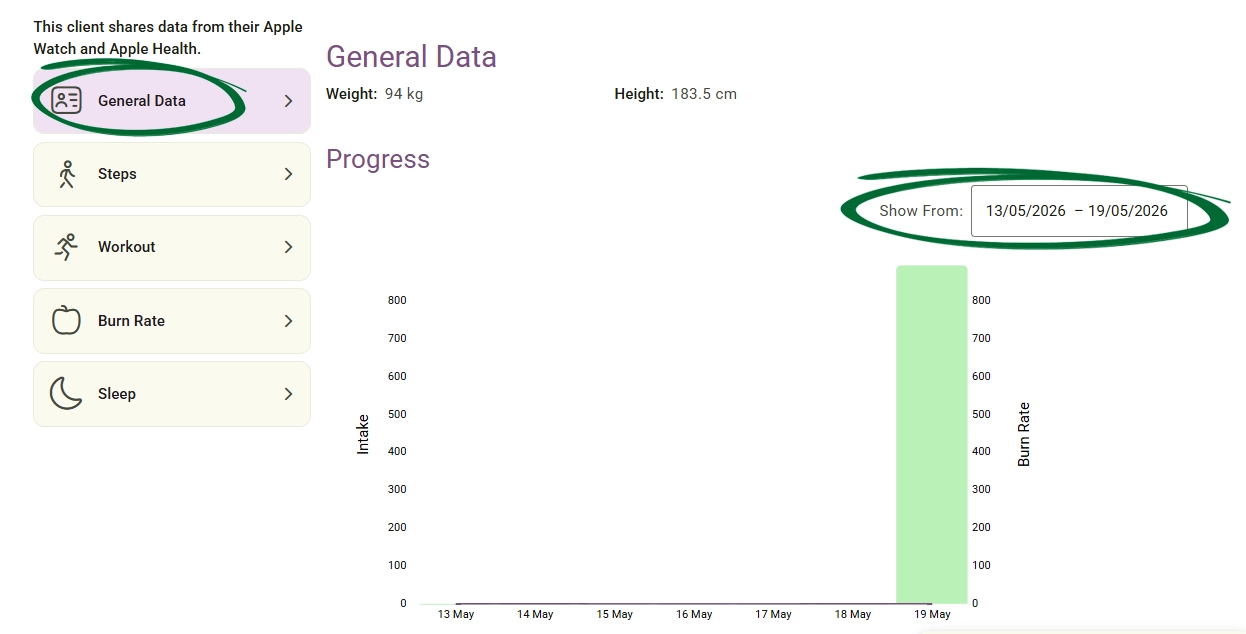
Look at the left-hand sidebar menu and click on the General Data option.
Client General Data
3
Check Fundamental Health Measurements

Look at the top of the section to instantly read the client's current registered metrics, such as Weight (in kg) and Height (in cm). 

4
Analyse the Progress Graph 

Examine the progress bar chart below the metrics to see how daily food intake balances out against the burn rate. Hover your mouse cursor over any individual day to see its exact values.  

Tip: Baseline measurements are highly useful for calculating your client's exact nutritional needs and daily energy targets before you look at their workout charts.
3. Monitor Client Steps & Distance

Track your client's daily movement levels by evaluating their total step counts alongside the actual physical distance they have covered.

1
Open the Activity Tab

Navigate to the specific client's profile page and click on the Activity Data tab from the main client navigation menu to open the wearable overview page.
Open Client Activity Data
2
Switch to the Steps Submenu
Click on the Steps option located in the left-hand category menu.
3
Review Daily Steps
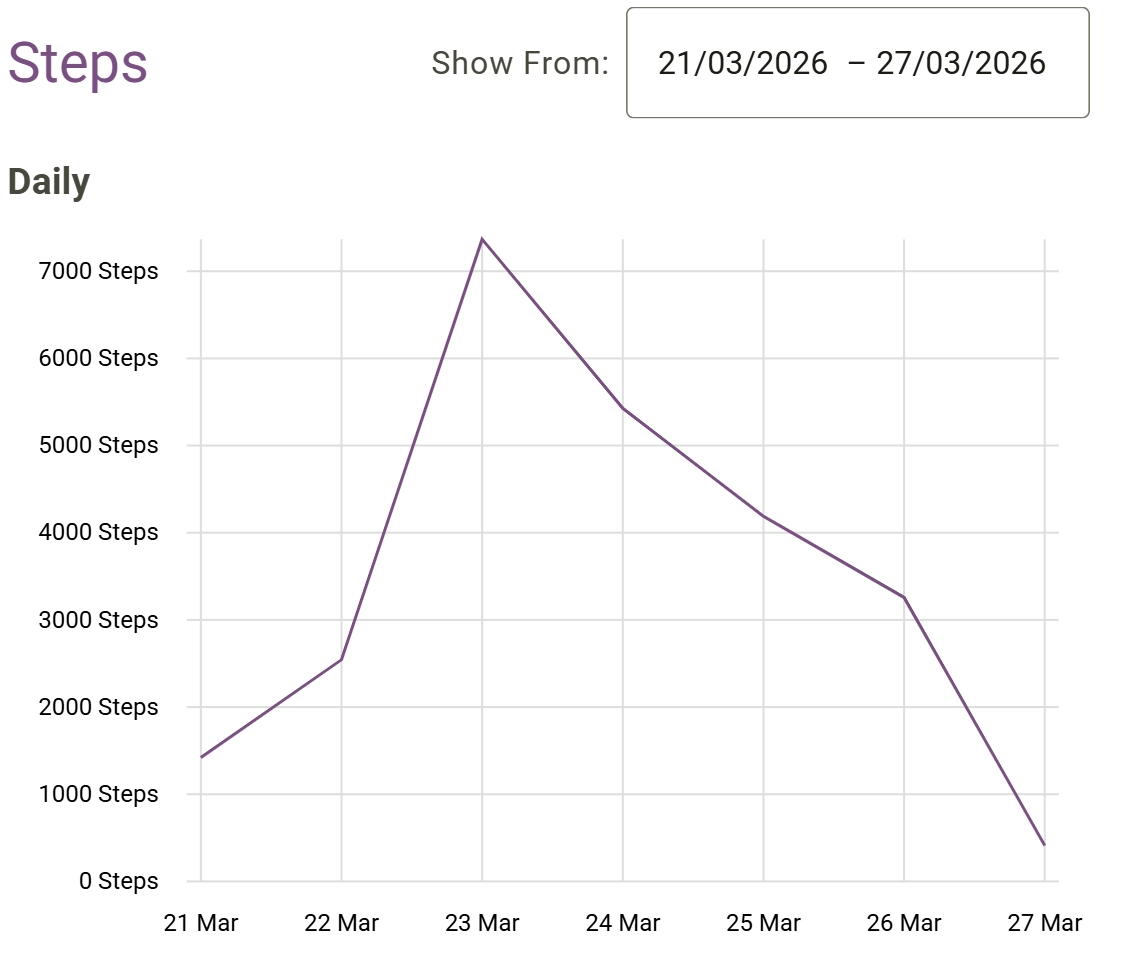
Study the top Steps line graph to see how your client's step count fluctuates across the selected days.
Client Steps screenshot
4
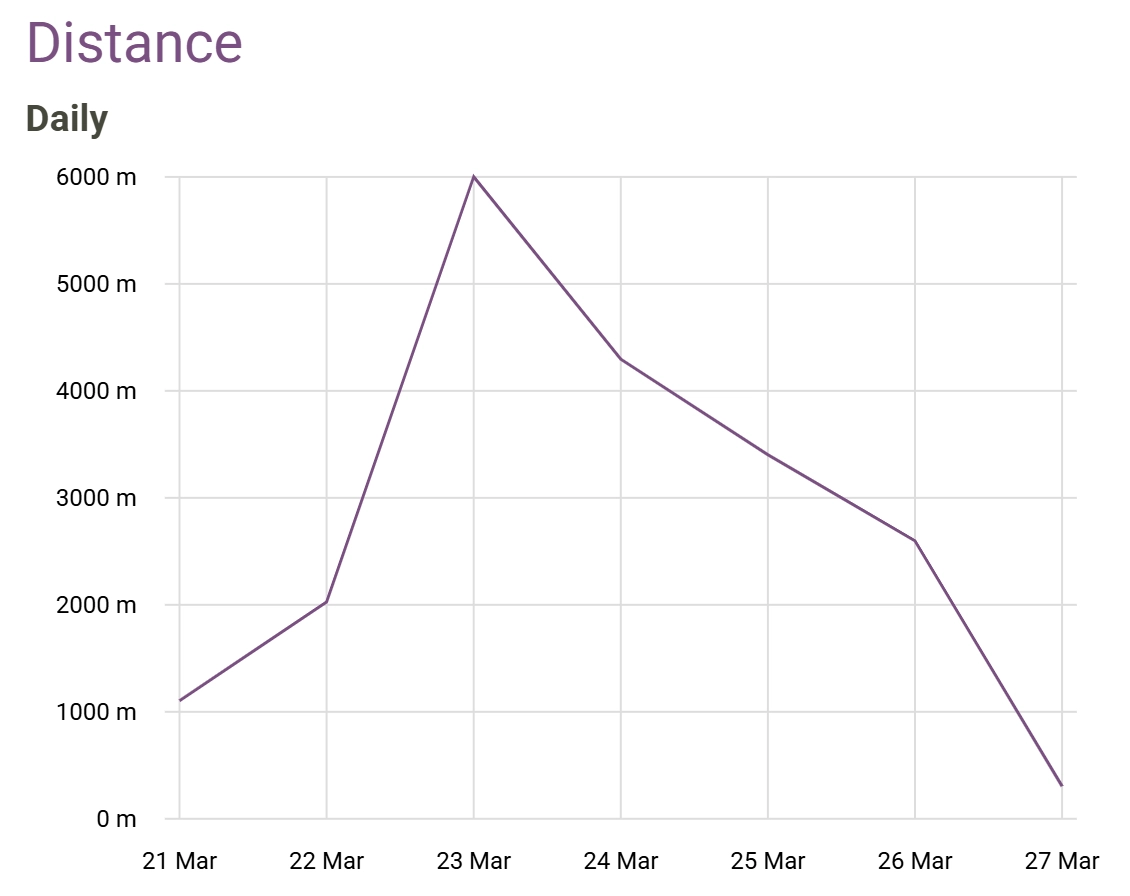
Evaluate Covered Distance
Scroll down slightly to look at the Distance line graph, which maps out the daily distance covered in metres (m) for the exact same timeframe.
Client Distance screenshot
5
Hover for Exact Daily Totals
Move your mouse cursor over any data point on either line graph. A vertical indicator line will appear, along with a small box showing the exact number of steps or metres recorded for that day.
Note: Comparing both graphs helps you understand your client's stride intensity, sharp peaks on both charts usually point to dedicated walking or running sessions.
4. Evaluate Client Workouts

Dive deep into specific exercise sessions, active durations, types of workouts, and the physiological response of your client during their training.

1
Open the Activity Tab

Navigate to the specific client's profile page and click on the Activity Data tab from the main client navigation menu to open the wearable overview page.
Open Client Activity Data
2
Navigate to Workouts
Select Workout from the vertical left-hand menu.
3
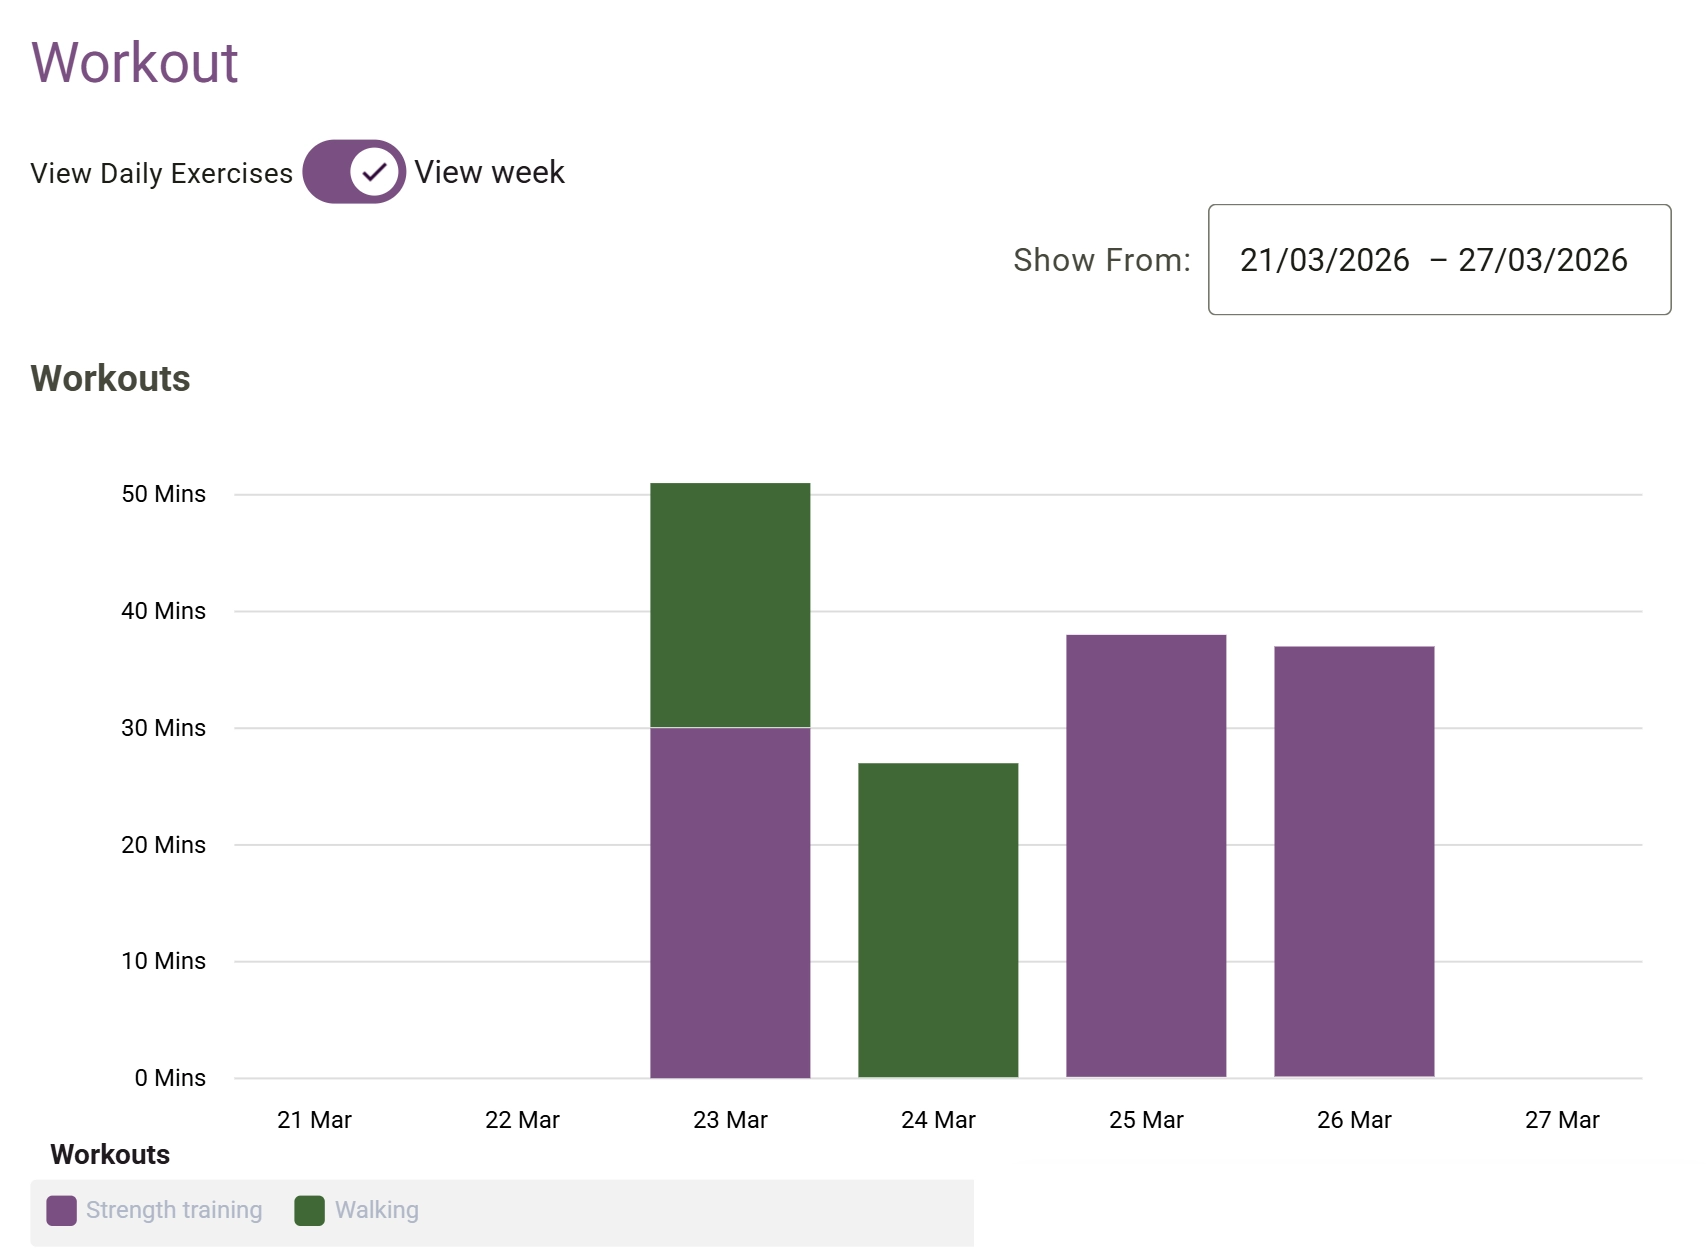
Toggle the View Mode
Use the View Daily Exercises / View week slider switch at the top to change how data points are grouped and layered on your screen.
Client Workout screenshot
4
Hover for Detailed Summaries
Move your mouse cursor over any colourful bar on the Workouts graph to trigger an informational tooltip containing the exercise type (e.g., Walking, Strength training), total minutes active, calories burned, and exact start time.
5
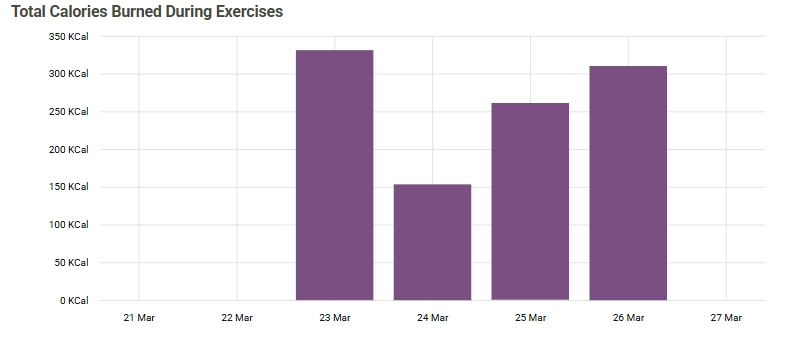
Review Cumulative Energy and Heart Rate Charts
Scroll further down to analyse the Total Calories Burned During Exercises (in KCal)
Client Calories screenshot

and the Average Heart Rate During Exercises (in Bpm) bar charts to assess workout intensity.
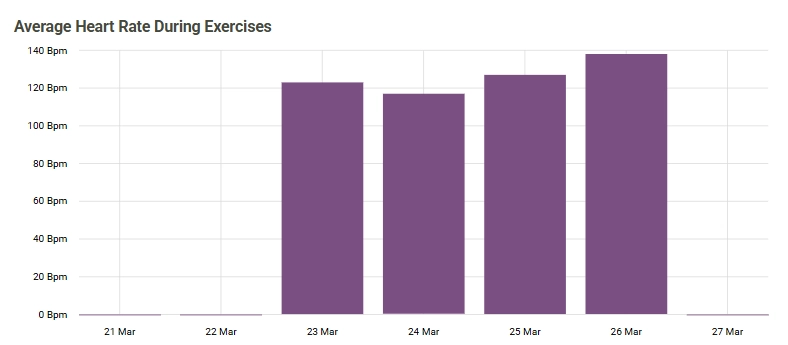
Client Average Heart Rate screenshot
Tip: The legend at the bottom of the workout chart uses colour-coded blocks to help you instantly distinguish between different training styles, such as strength sessions versus cardio.
5. Track Client Burn Rate

Dive deep into specific exercise sessions, active durations, types of workouts, and the physiological response of your client during their training.

1
Open the Activity Tab

Navigate to the specific client's profile page and click on the Activity Data tab from the main client navigation menu to open the wearable overview page.
Open Client Activity Data
2
Access Burn Rate Analytics
Click on the Burn Rate option in the sidebar menu.
3
Read Daily Metabolic Data
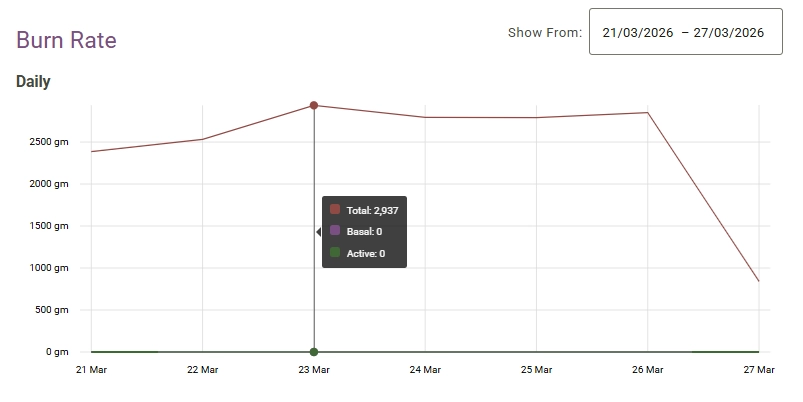
Study the Daily trend line graph that demonstrates daily metabolic activities measured across the selected timeframe.
Client Burn Rate screenshot
4
Hover for Metabolic Breakdowns
Move your mouse cursor over any day on the chart to see a dark pop-up box with your client's total, basal, and active burn rates for that day.
Tip: Consistent drops or unexpected spikes in the burn rate line can prompt a helpful discussion with your client regarding changes in their lifestyle or daily routine.
6. View Client Sleep Data

Assess sleep quality and rest durations to properly gauge your client's physical recovery and general well-being.

1
Open the Activity Tab

Navigate to the specific client's profile page and click on the Activity Data tab from the main client navigation menu to open the wearable overview page.
Open Client Activity Data
2
Open the Sleep Dashboard
Click on the Sleep button at the bottom of the left-hand sidebar menu.
3
Examine Daily Sleep Hours
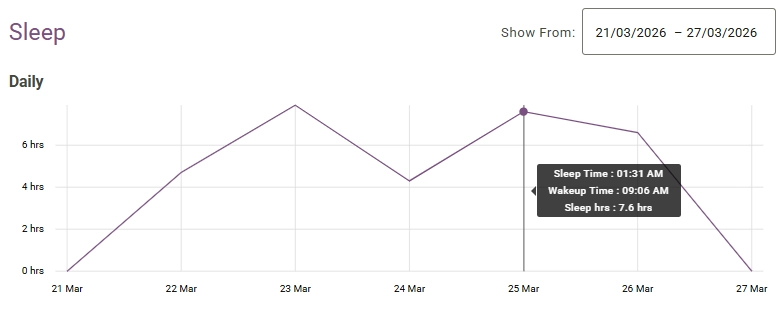
Review the Daily line graph showing the total duration of sleep tracked over the week (measured in hours).
Client Sleep Data
4
Examine Precise Sleep Timings
Hover your mouse over the data points on the line graph to bring up an explicit data box showing Sleep Time (bedtime), Wakeup Time, and the exact number of Sleep hrs accumulated.
Tip: Consistent rest is essential for muscle recovery and managing stress hormones. Keep an eye out for clients averaging fewer than 6 hours of sleep, as it can slow down their overall progress.
Frequently Asked Questions (FAQs)
Which wearable platforms and devices can sync data to the platform?
The platform supports data synchronisation from all major providers, including Apple Health, Health Connect, Fitbit, Garmin, Whoop, Polar, Strava, Oura, Withings, Dexcom, Suunto, Omron EU, Freestyle Libre, Coros, and Ultrahuman.
How can I view a client's data from a specific timeframe or past month?
Open the Activity Data tab, find the "Show From" date field on the right, and select your desired tracking window using the drop-down calendar.
What metrics can I see when hovering over the Workouts bar chart?
Hovering over a workout bar reveals an informational tooltip with the exercise type, total minutes active, calories burned, and exact start time.
Troubleshooting & Common Issues
Issue: The dashboard displays the message "You don't have any data to preview here".
Potential Solution:  This happens if the client has not synchronised their wearable device yet, or if there are no logged entries available during your selected date range.
Issue: The metric breakdown pop-up box does not appear on the Sleep or Burn Rate charts.
Potential Solution:  These tooltip boxes only show when you actively hover over a data point. Move your mouse cursor directly over the points on the line graph to trigger the detailed tooltips.

Next Step

Nicely done! Now that you're clued up on how your "Clients Activity Data" are getting on, let's make sure your Client Appointments are just as streamlined. Pop over to the next guide where we’ll unpack Client Appointments and get your scheduling down to a fine art.

Go to Client Appointments
Contact Support

Still need a hand?

Email Support: [email protected]